
Binary options are banned or restricted for retail traders in many countries, including the EU, the UK, Australia and Canada. In the United States, they are only allowed on regulated exchanges. Check the rules where you live before opening any account.
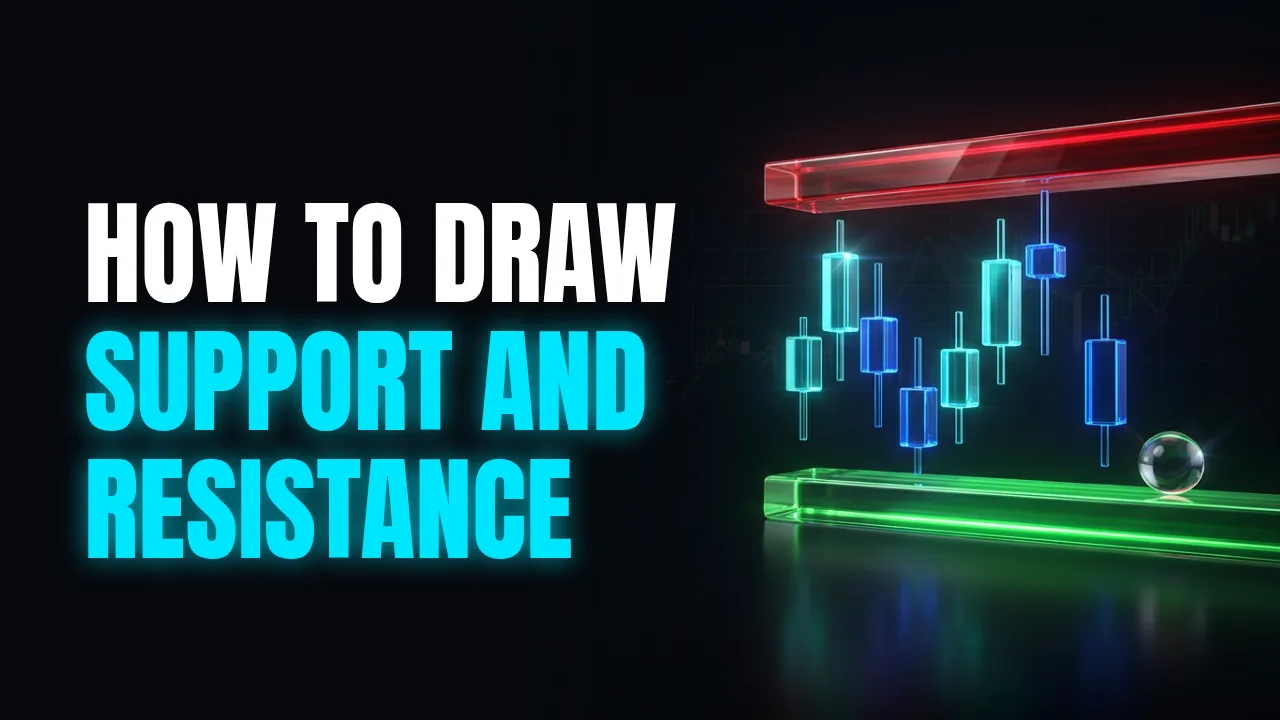
Support: A zone where the price tends to hold declines. See in the glossary is the zone where price stopped falling before. Resistance: A zone where the price tends to stall rallies. See in the glossary is the zone where price stopped rising before. Drawing these zones shows you where to pay attention on the chart and, more importantly, where to do nothing.
Most people enter in the middle of a move, with no reference at all, just because the Candle: Shows the open, high, low and close of the price. See in the glossary is moving. That is where accounts slip away. Support and resistance are not there to give you more entries. They are there to give you fewer, better ones.
In this article I show you what support and resistance are, how to draw the zones that matter in 4 steps, the mistakes that hurt the most and how to use all of this together with money management.
What support and resistance are
Think of the chart as the market's memory. Where a lot of people bought or sold before, price tends to react again.
- Support: a zone below price where drops stopped before. Enough buyers showed up there to hold it.
- Resistance: a zone above price where rallies stopped before. Enough sellers showed up there to stop it.
The key point: it is a zone, not a line. Price rarely stops at the exact same cent. It touches, pokes through a little, comes back. If you draw a thin line and expect ruler-like precision, you will get frustrated and enter too early.
| What you see on the chart | What it usually means |
|---|---|
| Price reaches support and leaves a lower wick | Buyers showed up in the zone again |
| Price reaches resistance and leaves an upper wick | Sellers showed up in the zone again |
| Price breaks through and closes candles on the other side | The zone may switch roles |
| Price drifts in the middle, far from the zones | No reference: time to wait |
How to draw support and resistance in 4 steps
- Start on a higher timeframe. Open the 1-hour or 15-minute chart, even if you trade on 1 or 5 minutes. The strong zones show up there first.
- Look for places where price turned at least twice. One touch is chance. Two or more show the zone has memory.
- Mark a zone, not a line. Use a rectangle that covers the bodies and wicks in that area. It is more honest about what price did.
- Move down to your timeframe and clean up. Keep only the 2 or 3 zones closest to the current price. The rest is clutter.
If you use the TradingView chart on Ideal Trade, the Advanced mode already has rectangles and horizontal lines in its drawing tools.
A tip that saves a lot of bad entries: round numbers often become zones. Price hovering around a "clean" number tends to react there, because many people are watching the same number.
How to use them in a trade
Drawing the zone is half the job. The other half is knowing what to do when price gets there.
- The zone tells you where. The reaction tells you when. Do not enter just because price touched it. Wait for a reaction, such as a strong Wick: The part of the candle that shows price rejection. See in the glossary rejecting the zone or a Strong Candle: A large candle showing buyers or sellers in control. See in the glossary turning the move.
- Price in the middle means wait. If it is far from support and resistance, you have no reference. Do not trade out of boredom.
- A Breakout: When the price moves past a support or resistance. See in the glossary needs confirmation. When price goes through a zone, wait for candles to close on the other side. Price often comes back to retest the broken zone, which has now switched roles.
- Combine it with just a few tools. A support zone that lines up with another level you already use stands out more than a zone on its own. But two tools are enough. Filling the screen with indicators only slows your decision down.
The 3 mistakes that hurt the most
1. Drawing too many lines. A chart with ten lines has a zone everywhere. Then any entry looks justified. If everything is support, nothing is.
2. Thinking the zone will always hold. Support and resistance show where a reaction is more likely. They do not ensure anything. At some point the zone breaks, and anyone without a daily stop enters again, and again, trying to "catch the bounce".
3. Raising your trade size because "this time it's a sure thing". A nice-looking zone does not change your trade size. In a binary option, the amount you put in is already the maximum loss on that trade. The zone changes where you enter. Your money management decides how much.
If you have not set that number yet, read the best money management for binary options before your next trade.
Support and resistance make you trade less
This is the benefit few people notice. When you only trade at the zones you drew, your number of entries drops on its own. You stop hunting for trades in the middle of nowhere and start waiting for price to come to you.
For beginners and impulsive traders, this is worth a lot: few trades, in places that make sense, with your amount and daily stop set beforehand. Trading less is what keeps you in the market.
If you are still learning how binary options work, start with what binary options are and their risks, and practice drawing zones on a demo account before using real money.
Want to keep learning with other traders? Join the free English Telegram group at the end of this page.
Summary
- Support is where drops stopped before. Resistance is where rallies stopped before.
- Draw zones, not thin lines, starting from a higher Timeframe: The time scale of the chart. See in the glossary.
- Keep 2 or 3 zones near the current price. The rest is clutter.
- The zone tells you where to pay attention. Price reaction tells you when to enter.
- A nice-looking zone does not change your trade size: money management decides that.
Fewer entries, more criteria. Trade with method.
Binary options and CFDs come with a high risk of loss, including the full amount of each trade. Support, resistance and any technical analysis do not ensure results: they help you organize your decisions. This content is educational and is not investment advice. Always start with a demo account.
Frequently asked questions
What are support and resistance?
Support is a price zone where drops stopped before because buyers showed up. Resistance is a zone where rallies stopped before because sellers showed up. They are the market's memory, not magic lines.
How do you draw support and resistance on a chart?
Start on a higher timeframe, look for places where price turned at least twice and mark a zone, not a thin line. Then move down to the timeframe you trade and keep only the 2 or 3 zones closest to the current price.
Do support and resistance work for binary options?
They work as a map: they show you where it makes sense to pay attention. They do not ensure price will bounce. That is why the entry needs confirmation from price reaction and a small, fixed amount per trade.
What happens when support breaks?
Old support often starts acting as resistance, and the opposite happens too. This is called a role reversal. Breakouts also fail, so your risk rules still apply.
Which timeframe should I use to draw support and resistance?
A higher one to see the strong zones, such as 1 hour or 15 minutes, and the timeframe you trade for fine-tuning. A zone that shows up on both is usually the one price respects most.
⚠️ Options and CFDs come with a high risk of loss. Educational content, not investment advice.

Cristiano Pereira has been trading since 2017, manually and with robots. He created the Trader Consistente method and the Trader Bots Club and Ideal Trade platforms. He teaches traders who keep blowing their accounts to trade with method, risk management and discipline, to withdraw profits and to build wealth. He does not sell daily profits.
cristianopereira.com.br → (opens in a new tab)